MATH 160 Music Affects the Ability of Rats Experiment La Report
Question Description
Progress Check
Use this activity to assess whether you and your peers can:
- Compare distributions to determine whether the primary goal of random assignment is achieved.
Learn by Doing
Use the rubric at the bottom of this page as a guide for completing this assignment.
Directions
Submit your work:
- Carefully read all sections below (beginning with the Context section and ending with the Prompt section).
- Commit a good-faith effort to address all items in the Prompt section below. Please be sure to number your responses.
Complete your assigned peer reviews:
- After you submit your initial good-faith attempt, continue to the ANSWER(S) page and review your instructor’s response. But please do not submit your corrected work yet.
- Within three days after the due date, return to this assignment and complete your assigned peer reviews (directions (Links to an external site.)).
Submit your corrected work:
- We all learn from mistakes (our own and our classmates’ mistakes). So please do not immediately correct your own mistakes. If possible, wait until you receive feedback from at least one of your peers.
- If necessary, correct your work and resubmit the entire assignment. Your instructor will only review and grade your most recent submission, so please do not refer to a previous submission.
Context
A high school student named David Merrell did an experiment to examine if music affects the ability of rats to run a maze. The explanatory variable was exposure to music. He had three treatment groups: one group listened to heavy metal music by the group Anthrax. A second group listened to Mozart. The third group never heard music. This last group is the control group.
The response variable was the average time (in seconds) to complete three runs. Every week the rats ran the maze three times. Merrell recorded each rat’s average time for the week.
Direct controls of potential confounding variables:
- Merrell trained all of the rats to run the same maze.
- He gave all mice the same amount of food and light.
- All mice had the same approximate age and weights.
- During the treatment phase, the rats were exposed to the treatment for the same amount of time, e.g. rats heard music at 70 decibels for 10 hours a day for a month.
Results:
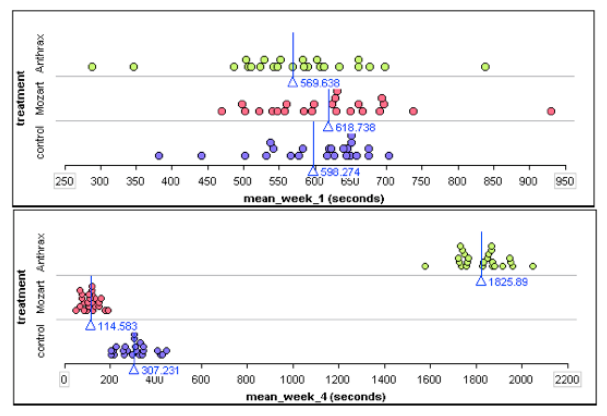
By the end of the month the Anthrax group was much slower at running the maze. The Mozart group was much faster. The dotplots below show average run times for the first and last week of the experiment. Each dot represents one rat. The X-value is the rats average run time for the week. (Each rat ran the maze 3 times each week.) The blue line is the mean run time for each treatment group.
If you are curious, here is a video of Merrell explaining his experiment.Merrell explaining his experiment (Links to an external site.)
(captioned version (Links to an external site.))
Prompt
Merrell claims that he randomly assigned rats to treatment groups. Does the data shown in the dotplots above support his claim? Why or why not?
"Place your order now for a similar assignment and have exceptional work written by our team of experts, guaranteeing you "A" results."
